
The Mott Street air monitoring station was established to determine the effect air emissions on air quality in the vicinity of a primary lead smelter facility in Herculaneum. Until 2013, Doe Run maintained a primary lead smelter in Herculaneum. The facility stopped smelting lead concentrates as per order of 2013 Consent Decree with the EPA. Doe Run now operates a refinery and strip mill as well as alloying and casting operations in Herculaneum.
Lead monitoring continues at the site to assess lead concentrations in the lead non-attainment area. Monitoring at this location is required by the consent agreement and done by both the Department of Natural Resources and the Doe Run Co.
To learn about other air monitoring sites the department operates as part of the state's ambient air monitoring network, visit Air Monitoring Sites.
Pollutants
Lead
Since 2008, the primary and secondary ambient air standards for lead have remained at 0.15 micrograms per cubic meter (μg/m3). The primary standard reflects EPA's concern for public health, while the second standard demonstrates concern for public welfare. EPA bases the standard on the highest rolling three-month average over a period of three years and two months. A monitoring site meets the standard when the lead concentration is less than or equal to 0.15 μg/m3 averaged over three months. The standard is not met if the concentration exceeds that level once or more within a three-year period.
- Three-month average lead concentrations for the most recent 12 months
- Map of Missouri's monitor sites for lead in ambient air
- Additional information about Lead State Planning efforts
Technical issues can affect ability to deliver quality data. Access a table of symbols with explanation of the problems they represent.
Sulfur Dioxide
In 2010, EPA not only established a new one-hour standard, but also introduced a new form for determining compliance. The primary National Ambient Air Quality Standard (NAAQS), based on health effects, for SO2 is 75 parts per billion (ppb) averaged over one hour. The new form requires three years of data — the average SO2 concentration from each hour of the year. The department and EPA calculate the design value, using the 99th percentile of one-hour daily maximum concentrations, averaged over three years.
*All times listed in reports reflect Central Standard Time (CST).
- One-hour SO2 design values
- Four highest one-hour SO2 values year-to-date
- Map of Missouri's SO2 monitoring sites
Additional information about Sulfur Dioxide State Planning efforts
Technical issues can affect ability to deliver quality data. Access a table of symbols with explanation of the problems they represent.
- SO2 data in third column
- Data from past 10 days through current date
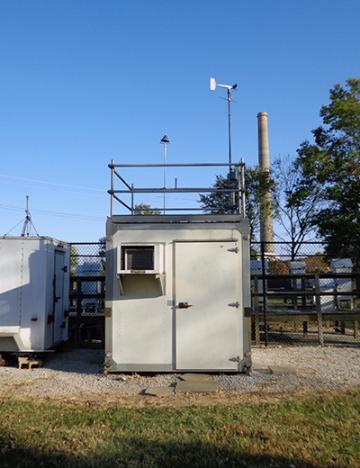
747 Mott St.
Herculaneum, MO 63048
United States
Air Pollution Control Program
Division of Environmental Quality
P.O. Box 176
Jefferson City, MO 65102-0176
United States